Process flow
Process flow shows how your cases actually move from one activity to the next. Where Edit shows the model you built and Object flow follows a single case, Process flow shows the behaviour of all your cases at once.
You reach it from the toggle at the bottom left of a process. See Process.
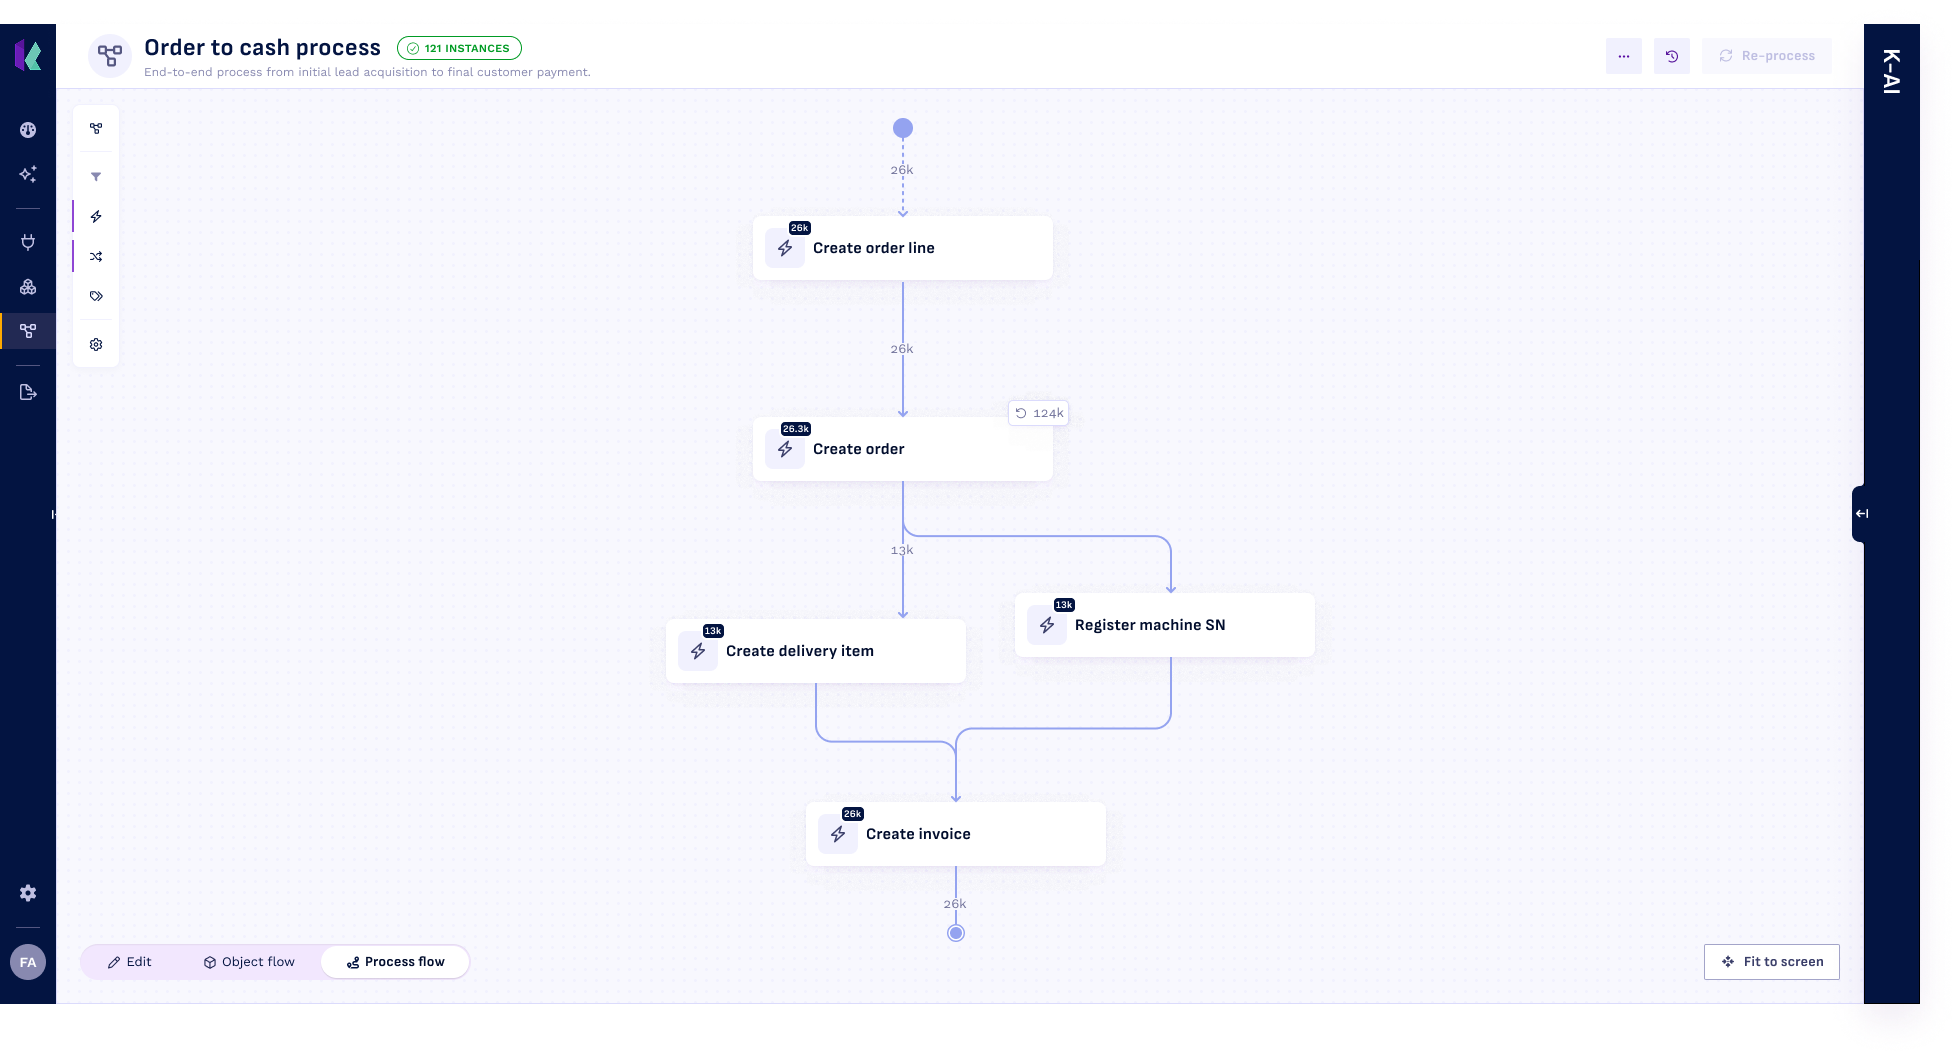
Reading the flow
Each box is an activity, and each arrow means one activity was directly followed by another. The flow runs between the circles at the start and the end.
The number on an arrow tells you either how often that step happened or how long it took on average, depending on what you choose under Display settings. An arrow that loops back on itself means the activity repeated.
The panels you see in Edit and Object flow are hidden here, since the flow is built from all your cases rather than a single one.
Choosing what to show
A menu on the left controls what the flow is built from.
Process
Pick which process to draw. You are not limited to the one you are on: any process in the workspace that has been built can be chosen here.
Variants
A variant is one distinct path through your process. Every case that went through exactly the same activities in exactly the same order belongs to the same variant. Most processes have a few common variants and a long tail of rare ones, and that split is usually where the interesting questions are.
Variants opens the Variant explorer, which lists them with:
| Column | What it shows |
|---|---|
| Variant | The path itself |
| #Cases | How many cases followed it |
| Share | What portion of all your cases that is |
| Avg Duration | How long those cases took on average |
Tick the variants you want and the flow redraws using only those cases. Starting with the largest few is a good way to see the mainstream path before the exceptions crowd it out.
Activities
Narrows the flow further, down to particular activities within the variants you selected. Each one shows how many instances it has and what share of the total that is.
Display settings
- Edges controls how many connections are drawn, as a percentage. Lower it to strip out rare paths and leave the backbone of the process. Raise it to see everything, including the unusual routes.
- Frequency or Duration decides what the numbers on the arrows mean: how often a step happened, or how long it took on average.
When the flow is empty
Process flow is calculated from processed data, so it cannot always draw something:
- The process has not been processed yet. Select Process to calculate it.
- The process is still processing. The flow appears once that finishes.
- There are no cases to build a flow from.
- No variants are selected. Pick at least one in the Variant explorer.
- No activities remain. Your variant and activity selection has excluded everything, so widen one of them.